-

-
-
Product

What's New?

Majority of our clients have saved upto 8 hours every week, by automating iterative and difficult processes.
Learn more
Solutions
One app, all things legal
-
-
-
 Dropbox
  Zapier
  Quickbooks
  vs CosmoLex
  vs PracticePanther
  vs AbacusNext
  vs Caret Legal
  vs Clio
  vs MyCase


Feature Release: All New Time Insights
10th March 2026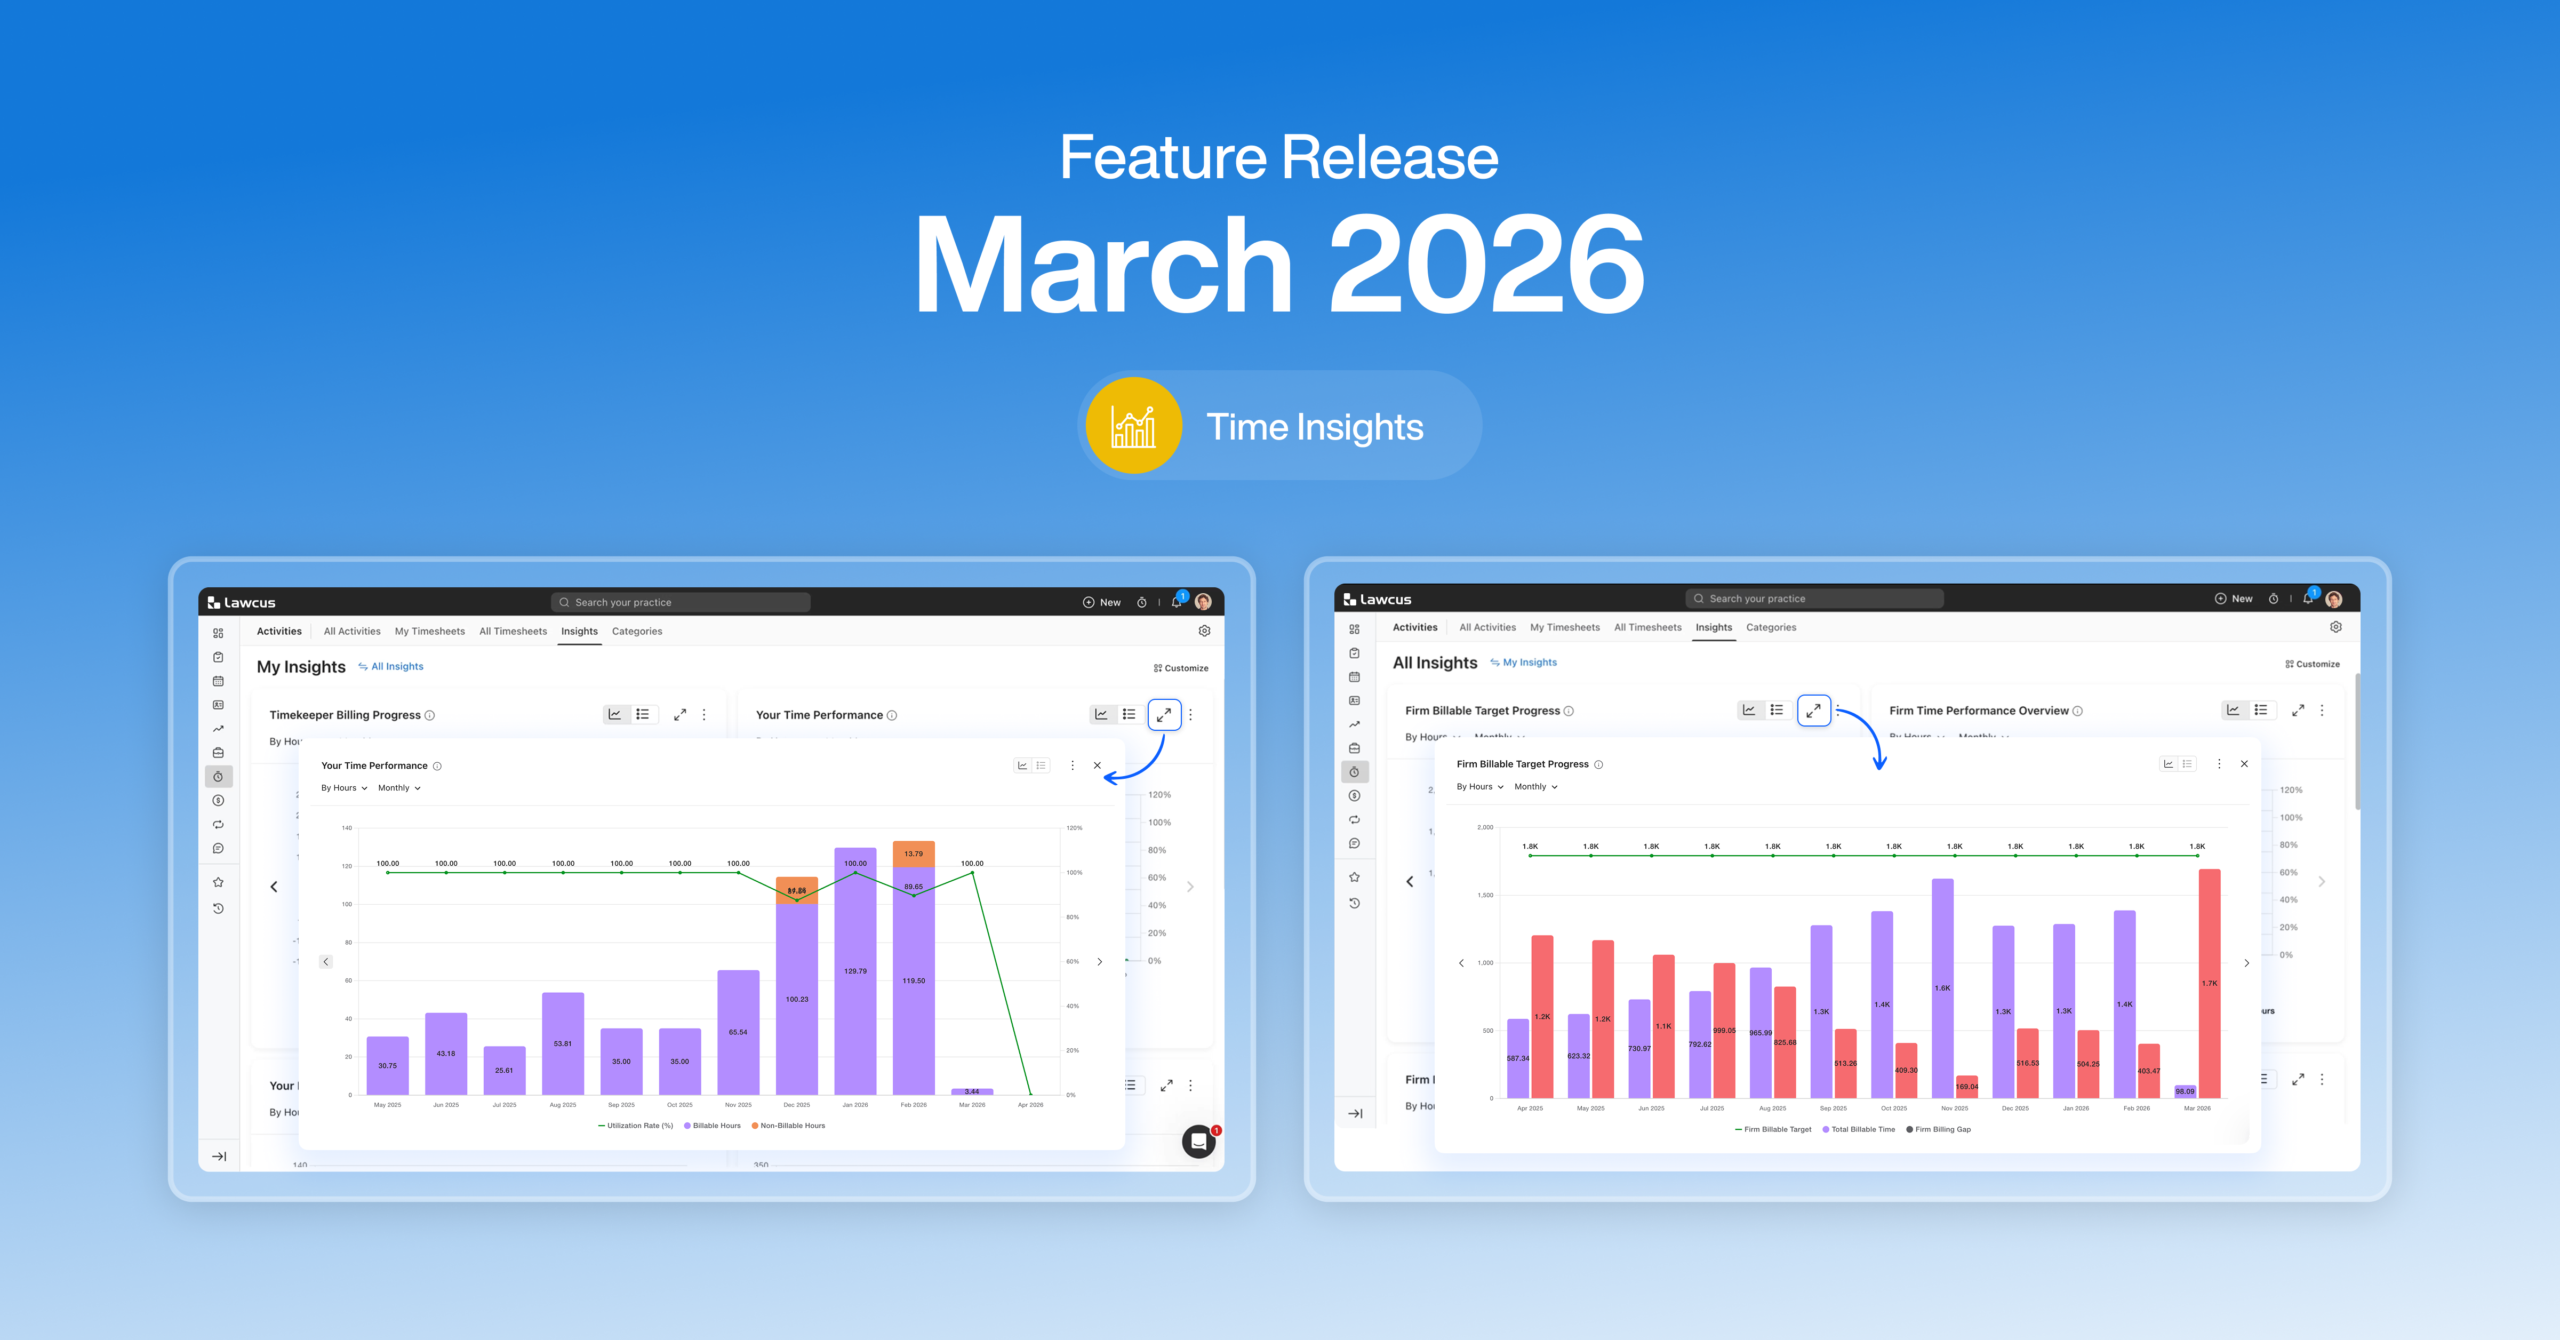
In today’s legal environment, successful firms aren’t driven by intuition alone, they’re driven by data, visibility, and timely decision-making.
Every day, your firm generates operational data across time entries, billing activity, work in progress (WIP), utilization, and productivity. But for most firms, that data ends up buried in month-end reports, spreadsheets, or static dashboards, useful, but often too late to change outcomes.
Insights in Lawcus changes that.
Insights makes firm performance real-time, actionable, and business-focused, so you can spot issues early, take action faster, and run a more predictable and profitable practice. And today, we’re launching the first set of Insights: Time Insights.
Why Time Insights matters
Time is the most critical driver of law firm revenue and also the easiest place for revenue leakage to hide. With Time Insights, firms can:
- Track billable time as it’s being recorded
- Monitor WIP before it becomes a problem
- Identify operational hurdles early
- Improve utilization and billing discipline
- Act before revenue is impacted
This is the beginning. In the coming quarters, Insights will expand into Matters, Leads, Billing & Collections, and Accounts Receivable giving firms a connected view from intake to cash.
Two levels of Time Insights
Time Insights is designed to serve both leadership and individual users, without overwhelming either.
All Insights (Firm Level): includes 8 powerful charts designed for firm owners, partners, and admins who need a firm-wide view of performance what’s happening across people, clients, matters, and practice areas. Learn more.
My Insights (Individual Level): gives timekeepers 6 high-impact charts to track visibility into personal progress, utilization, billing output, and what needs action. Learn more.
Permissions can be configured so each role sees the right level of insight.
My Insights: Built for timekeepers who want to stay on track
1. Timekeeper Billing Progress
This chart answers a simple but critical question: Am I on track against my billable target? You can view progress by Hours (billable time logged) or Amount (value of billable work). For each month, quarter, or year:
- The bars show your Actual Billable Time
- The remaining portion highlights what’s left to hit your target
- A target line shows where you’re expected to land for that period
The best part: you can drill down into your actuals to see which clients and matters are driving your billable output, so you’re not just measuring progress, you’re understanding it.
2. Billable vs Non-Billable + Utilization Trend
This chart helps you see how your time is being spent and how effectively that effort turns into billable work.
- Stacked bars show your total recorded time, split into Billable and Non-Billable
- A line shows your Utilization Rate (the percentage of your time that is billable)
- Toggle between Hours and Amount depending on whether you want time impact or financial impact
When utilization drops, this view helps you immediately connect it to the underlying mix, for example, a spike in administrative work or internal tasks. You can drill down by client and matter to understand where that shift came from.
3. Your Billable Value Breakdown
This chart connects effort to outcomes. It shows how your billable work converts into invoices, and where value is still waiting. Each period breaks your billable value into:
- Invoiced (already billed)
- Uninvoiced (WIP still pending billing)
- Discounts (reductions impacting realized value)
This is especially useful when you’re “busy” but revenue feels delayed, because it makes invoicing gaps visible. And with drill-downs into clients and matters, you can quickly identify where work is accumulating without being billed.
4. Your Uninvoiced WIP Aging
Unbilled work becomes riskier the longer it sits. This chart helps you understand:
- How much uninvoiced WIP you currently have
- How old it is
- What needs urgent billing attention
Your WIP is grouped into aging buckets: 0–30, 31–60, 61–90, and 90+ days, alongside a clear Total Uninvoiced WIP view.
This makes it easy to prioritize older items first, because older WIP is more likely to be delayed, disputed, or written off. Drill down by client and matter to go straight from insight to action.
5. My Top X Matters Pending Invoicing
This is designed to be your “what should I bill next?” list. It ranks matters based on uninvoiced billable value and shows:
- Matter and client (both clickable)
- Unbilled hours and amount
- Billing timekeeper
- Last time recorded (to spot stalled work)
You can personalize it by choosing Top 5, Top 10, or more, so it fits how you work. For many firms, this becomes a simple weekly habit: review the list, clear high-value WIP, and reduce billing delays.
6. Peer Benchmark by Title
Context matters. A newer associate and a senior partner shouldn’t be measured the same way. Peer Benchmark by Title compares your performance against the firm average for your role, over time. You can switch views:
- Utilization %
- Hours
- Amount
This gives timekeepers a healthy, role-based benchmark, and gives leadership a more meaningful way to understand whether performance gaps are individual, role-specific, or systemic.
All Insights: Firm-level visibility for leaders who want to run proactively
1. Firm Billable Target Progress
This is your firm-wide “are we on track?” view. For each period:
- Bars show Total Billable Time and the Firm Billing Gap
- A line shows the Firm Billable Target
- Toggle between Hours and Amount, and view Monthly/Quarterly/Annual
The power here is drill-down. Leadership can break targets and gaps down by timekeeper and title, then analyze actual billable work by clients, matters, responsible/originating timekeepers, practice areas, and pipelines, turning a high-level variance into an action plan.
2. Firm Time Performance Overview
This chart shows how the firm’s time is being used and whether it’s translating into billable work efficiently.
- Stacked bars: total time split into Billable vs Non-Billable
- Utilization line: firm-wide efficiency trend
- Toggle between Hours/Amount, and view across periods
This is ideal for spotting early operational drift, such as rising internal workload, inconsistent time logging, or changing utilization across practice areas.
3. Firm Billable Value Breakdown
This view ties work to revenue outcomes at the firm level:
- Total billable work
- Invoiced portion
- Uninvoiced WIP
- Discounts
If the uninvoiced portion grows or discounts increase, leaders can drill down to see where it’s coming from and address it before month-end surprises.
4. Firm Uninvoiced WIP Aging
WIP aging is one of the clearest early-warning indicators for revenue risk. his chart shows uninvoiced WIP across the firm in aging buckets (0–30, 31–60, 61–90, 90+) plus total WIP. It’s perfect for monthly billing reviews and cash-flow forecasting and helps leadership enforce better billing discipline without guesswork.
5. Top X Matters Pending Invoicing (Firm)
This ranked list highlights the matters across the firm holding the most uninvoiced value and surfaces the data needed to act:
- Unbilled hours/amount
- Last time recorded
- Oldest unbilled age (days)
- Billing timekeeper and client
It’s a straightforward way to focus billing attention on what will move the needle most.
6. Top / Bottom X Utilized Timekeepers
These lists make capacity and imbalance visible. They show utilization %, billable hours, and target hours, helping leadership identify:
- Overloaded timekeepers (burnout risk)
- Underutilized team members (work allocation gaps)
- Trends that indicate staffing or workflow issues
This is about resourcing decisions, not just performance measurement.
7. Billable by Practice Area
This chart shows where the firm’s billable work is actually coming from, by practice area, across time. It helps answer:
- Which practices are driving billable output?
- Which areas may need staffing or business development focus?
- Are strategic practice areas growing or declining?
With drill-downs available, leadership can connect practice performance to specific clients, matters, teams, or pipelines.
From visibility to action, without waiting for month-end
Time Insights is built around a simple promise: The data is already there. Now it’s accessible, visible, and meaningful, as work happens, not weeks later.
Whether you’re a timekeeper trying to stay consistent, or a firm leader trying to protect revenue and forecast confidently, Time Insights helps you:
- spot gaps early,
- understand the “why” behind the numbers,
- and act directly from the insight.
Integrations
Clerx.AI
The integration of Clerx.AI with Lawcus delivers a powerful 24/7 AI receptionist and client intake solution built specifically for law firms, ensuring every inbound call is answered professionally, every lead is captured with structured client and matter details, and every inquiry is automatically organized inside Lawcus—while also enabling instant consultation scheduling with real-time calendar sync, improving lead conversion through immediate responses, reducing administrative workload by automating receptionist and intake tasks, and creating a consistent, professional first impression from the very first call.
Eternal Pro
The Lawcus and Eternal Pro integration brings together powerful legal practice management with enterprise-grade workflow automation — enabling law firms to eliminate manual processes, improve operational visibility, and scale with precision. This integration is designed for modern law firms that want to automate beyond basic task creation and truly orchestrate their intake, matter lifecycle, billing workflows, and internal approvals across systems.
This release is just the beginning.
2026 is a big year for Lawcus. Time Insights kicks off a series of major product releases focused on giving law firms more visibility, control, and confidence in how they run their practice. From deeper Insights across matters and billing, to smarter automation and AI-powered workflows, we’re building tools that help firms work better, not harder.
If you’d like to see Time Insights in action or explore what’s coming next, reach out to the Lawcus team. We’d love to walk you through what’s live today and what’s on the roadmap for 2026. This is only the start, and we’re excited to build the future of smarter law firm operations with you.
Practice Management
Automation
Client Intake & CRM
Billing & Accounting
Practice Area
Compare
Resources
Lawcus Inc.
4445 Eastgate Mall, Suite 200,
San Diego, CA 92121


