One app, all things legal
Lawcus streamlines Legal Practice Management, CRM, Client Intake, and no-code automation so you can focus on what truly matters: your clients!


Our website uses cookies to deliver the best customer experience. By continuing to browse or by clicking 'Accept', you agree to our cookie policy. Accept
Lawcus streamlines Legal Practice Management, CRM, Client Intake, and no-code automation so you can focus on what truly matters: your clients!
Average Increase in
Caseloads
Our Legal automation software saves upto 2 billable hours per day on average, giving opportunity of growth.
hours
saved/week
Majority of our clients have saved upto 8 hours every week, by automating iterative and difficult processes.
Increase In
Revenue
Our clients have reported an increase of 20% in revenue with the best comunication automation tools.


A simple time tracking built for speed and ease of use. Ability to add flat fee entries to your legal practice management system.
Generate all your invoices in just two clicks with our legal billing software. Trust accounting to help you manage your client's money with ease.
Online payments powered by LawPay and Confido Legal to help you get paid faster. Say goodbye to chasing down client payments ever again with our law practice management software .


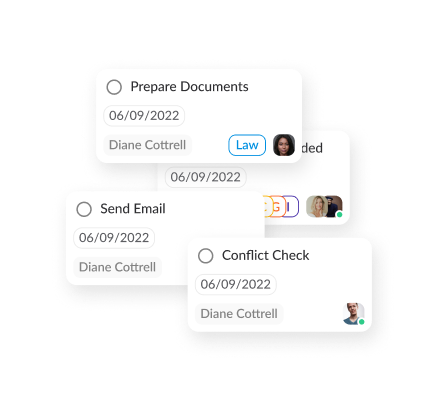
Tired of creating the same tasks every time? Handle repetitive tasks automatically that can sometimes fall through the cracks.
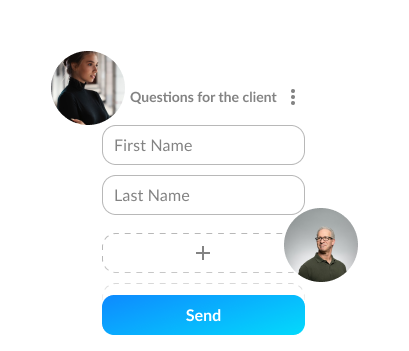
Send automated personalized emails, text messages, reminders, intake forms, and engagement agreements to clients.


Just set rule-based triggers and actions, and let the automation do the actual admin work from client intake to billing with the best legal practice management software.
Lawcus guarantees that all your legitimate information and case reports are free from any danger in the cloud with bank grade security. Lawcus stores all of your law firm’s data at 256-bit AES encryption, the same standard used by financial institutions.
We're built on Amazon AWS cloud, strongest encryption at rest & transition. Gain the confidence you need to securely run your legal business with the most secure cloud computing environment.
Lawcus allows you to protect your data with the ability to set up two factor authentication on your legal practice management software and decide who can see what!


