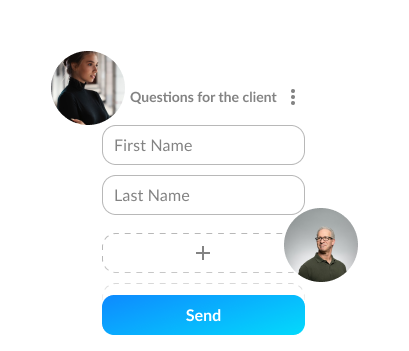
We’re pleased to announce the launch of our new Customer Relationship Management (CRM). Lawcus CRM offers a simple pipeline view to help Law firms seamlessly navigate leads in one integrated package. You can track your lead sources, referrals, and pipeline value of the fees expected to be earned on the potential matters.
Click to learn how to create and manage leads.
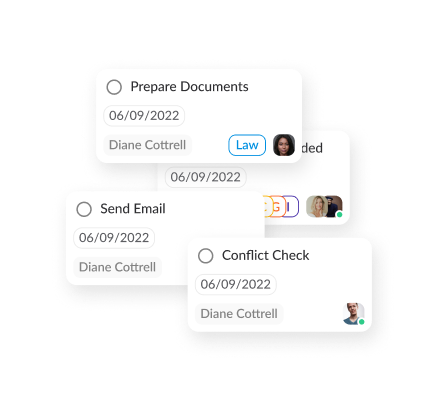
We are also introducing our new Workflow Automation feature that will instantly eliminate hours of admin work from your week. With this feature, you can automate and streamline the entire process from client intake to billing and make lives easier for everyone at your law firm. Workflow automation can help you handle repetitive tasks automatically that can sometimes fall through the cracks or be executed poorly or incompletely. You just need to configure workflows that can automate creating of matters, creating of tasks, sending of e-mails & texts, and many more actions, based on custom triggers.
Click to learn how to create workflows.
We're proud to introduce a fresher, simpler, and better way to manage your law firm
ALWAYS IMPROVING: We're continually working to refine Lawcus so you can take your practice to the next level.
NEW FEATURES:
The new dashboard is designed with customization and flexibility at the center of the experience. We have dramatically increased the ability to easily customize dashboards and present data in a simple, visual format that gives you an immediate snapshot of the performance metrics that matter to you.
The new dashboard lets you build beautiful dashboards from the list of premade widgets that you can add, remove, resize, and rearrange. We introduce you to the 6 new widgets.
The Lead Trends panel gives an overview of how successful you have been in converting your leads into matters. This panel is a combined version of the Leads Added panel, Conversion Rate panel, and the Pipeline Value panel.
This section shows you:
Note: If you move the pointer over any data point in the graph, Lawcus shows you the values on that particular day. For example, in the following screenshot, we can see that on 09/22 we added 1 new lead, and converted 2 leads into clients (remember, conversions are based on the total number of leads in the pipeline); thus we have a conversion rate of 200%.
Click on the View All icon () to see an expanded view of the graph.
Click the Cancel button to return to the normal view.
This panel shows you the Conversion Rate for the selected period. It shows you the data as a line graph and also as break-up of that data (by Lead Source or by Practice Area). For each break-up category, it shows you the number of conversions and the dollar value of those conversions.
Note: If you move the pointer over any data point in the graph, Lawcus shows you the Conversion values on that particular day.
From this drop-down list, you can select whether you want to see the data by Week or by Month and by Lead Source or by Practice Area.
The number of conversions is a link, and if you click on the link, Lawcus drills down into the data and shows you the names of the leads that were converted.
The lead names too are links, and if you click on a lead name, Lawcus drills further down and shows you the Lead Details screen for that lead.
Tip: Click on the Close button at the top-right of the Lead Details screen to return to the Dashboard. (See Viewing your Leads for more information on the Lead Details screen.)
If you do not want to drill-down to the Lead Details screen, click anywhere outside the box showing the leads to return to the previous screen.
Click on the View All icon () to see an expanded view of the graph.
Click the Cancel button to return to the normal view.
This panel shows the total value of all leads added in the pipeline for the selected period. It shows you the data as a line graph and also as break-up of that data (by Lead Source or by Practice Area). For each break-up category, it shows you the dollar value of the leads in that category.
Note: If you move the pointer over any data point in the graph, Lawcus shows you the values on that particular day.
The dollar value is a link, and if you click on the link, Lawcus drills down into the data and shows you the names of the leads.
The lead names too are links, and if you click on a lead name Lawcus drills further down and shows you the Lead Details screen for that lead.
Tip: Click on the Close button at the top-right of the Lead Details screen to return to the Dashboard. (See Viewing your Leads for more information on the Lead Details screen.)
If you do not want to drill-down to the Lead Details screen, click anywhere outside the box showing the leads to return to the previous screen.
Click on the View All icon () to see an expanded view of the graph.
Click the Cancel button to return to the normal view.
This panel shows the leads added to the pipeline in the selected period. It shows you the data as a line graph and also as break-up of that data (by Lead Source or by Practice Area). For each break-up category, it shows you the number of leads in that category, and the percentage value of the category when compared with all the other categories.
Note: If you move the pointer over any data point in the graph, Lawcus shows you the values on that particular day.
Each row is a link, and if you click on the link, Lawcus drills-down into the data and shows you the names of the leads.
The lead names too are links, and if you click on a lead name Lawcus drills further down and shows you the Lead Details screen for that lead.
Tip: Click on the Close button at the top-right of the Lead Details screen to return to the Dashboard. (See Viewing your Leads for more information on the Lead Details screen.)
If you do not want to drill down to the Lead Details screen, click anywhere outside the box showing the leads to return to the previous screen.
If there is more data than will fit in the panel, Lawcus displays a link at the bottom of the panel. Click on the link to open the expanded view of the panel.
Click on the View All icon () to see an expanded view of the graph.
Click the Cancel button to return to the normal view.
This panel shows the reasons for leads not being hired/converted in the selected date range, the number of leads lost for each reason, and the percentage value of the reason when compared with all the other reasons.
Each reason is a link. If you click on it, Lawcus displays the names of the Leads that were rejected for that reason.
The lead names too are links, and if you click on a lead name Lawcus drills further down and shows you the Lead Details screen for that lead.
Tip: Click on the Close button at the top-right of the Lead Details screen to return to the Dashboard. (See Viewing your Leads for more information on the Lead Details screen.)
If you do not want to drill-down to the Lead Details screen, click anywhere outside the box showing the leads to return to the previous screen.
If there are more reasons than will fit in the panel, Lawcus will display a "more" link at the bottom of the panel. Click on this link to see the expanded view of this panel.
Alternatively, you can click on the View All () icon to open the Expanded view.
Click on the Cancel button to return to the Normal view.
This panel shows the top referrers for the selected date range, the number of leads referred, and the percentage value when compared to the total number of leads referred in that period.
Each referrer name is a link. If you click on it, Lawcus displays the names of the Leads that were referred by that person.
The lead names too are links, and if you click on a lead name Lawcus drills further down and shows you the Lead Details screen for that lead.
Tip: Click on the Close button at the top-right of the Lead Details screen to return to the Dashboard. (See Viewing your Leads for more information on the Lead Details screen.)
If you do not want to drill-down to the Lead Details screen, click anywhere outside the box showing the leads to return to the previous screen.
Alternatively, you can click on the View All () icon to open the Expanded view.
Click on the Cancel button to return to the Normal view.
Note: You can customize the view of your dashboard by hiding and/or resizing panels. See Customizing your Dashboard for more details.
No Hype, No BS -- just an awesome Legal Practice Management Software!